

![]()

R
Code to download Datasets from Kenneth
French’s famous website.With version 1.1.0 we have added the possibility to format the data
sets saved in the list as tibble for direct proceeding.
One often needs those datasets for further empirical work and it is a tedious effort to download the (zipped) csv, open and then manually separate the contained datasets. This package downloads them automatically, and converts them to a list of xts-objects that contain all the information from the csv-files.
Original code from MasimovR https://github.com/MasimovR/. Was then heavily redacted by me.
You can install FFdownload from CRAN with
install.packages("FFdownload")or directly from github with:
# install.packages("devtools")
devtools::install_github("sstoeckl/FFdownload")In this example, we use FFDwonload to
library(FFdownload)
temptxt <- tempfile(fileext = ".txt")
# Example 1: Use FFdownload to get a list of all monthly zip-files. Save that list as temptxt.
FFdownload(exclude_daily=TRUE,download=FALSE,download_only=TRUE,listsave=temptxt)
FFlist <- readr::read_csv(temptxt) %>% dplyr::select(2) %>% dplyr::rename(Files=x)
FFlist %>% dplyr::slice(1:3,(dplyr::n()-2):dplyr::n())
#> # A tibble: 6 × 1
#> Files
#> <chr>
#> 1 F-F_Research_Data_Factors_CSV.zip
#> 2 F-F_Research_Data_Factors_weekly_CSV.zip
#> 3 F-F_Research_Data_Factors_daily_CSV.zip
#> 4 Emerging_Markets_4_Portfolios_BE-ME_OP_CSV.zip
#> 5 Emerging_Markets_4_Portfolios_OP_INV_CSV.zip
#> 6 Emerging_Markets_4_Portfolios_BE-ME_INV_CSV.zipinputlist to only download the datasets we actually
need.tempd <- tempdir()
inputlist <- c("F-F_Research_Data_Factors","F-F_Momentum_Factor","F-F_ST_Reversal_Factor","F-F_LT_Reversal_Factor")
FFdownload(exclude_daily=TRUE,tempd=tempd,download=TRUE,download_only=TRUE,inputlist=inputlist)tempf <- paste0(tempd,"\\FFdata.RData")
getwd()
#> [1] "D:/OneDrive - University of Liechtenstein/ROOT/Packages/ffdownload"
FFdownload(output_file = tempf, exclude_daily=TRUE,tempd=tempd,download=FALSE,
download_only=FALSE,inputlist = inputlist, format="tbl")
#> | | | 0% | |================== | 25% | |=================================== | 50% | |==================================================== | 75% | |======================================================================| 100%library(tidyverse)
library(timetk)
load(file = tempf)
FFdata$`x_F-F_Research_Data_Factors`$monthly$Temp2 %>%
left_join(FFdata$`x_F-F_Momentum_Factor`$monthly$Temp2, by="date") %>%
left_join(FFdata$`x_F-F_LT_Reversal_Factor`$monthly$Temp2,by="date") %>%
left_join(FFdata$`x_F-F_ST_Reversal_Factor`$monthly$Temp2,by="date") %>% head()
#> # A tibble: 6 × 8
#> date Mkt.RF SMB HML RF Mom LT_Rev ST_Rev
#> <yearmon> <dbl> <dbl> <dbl> <dbl> <dbl> <dbl> <dbl>
#> 1 Jul 1926 2.96 -2.56 -2.43 0.22 NA NA -1.87
#> 2 Aug 1926 2.64 -1.17 3.82 0.25 NA NA 1.43
#> 3 Sep 1926 0.36 -1.4 0.13 0.23 NA NA -0.17
#> 4 Okt 1926 -3.24 -0.09 0.7 0.32 NA NA -2.11
#> 5 Nov 1926 2.53 -0.1 -0.51 0.31 NA NA 1
#> 6 Dez 1926 2.62 -0.03 -0.05 0.28 NA NA 2.01FFfive <- FFdata$`x_F-F_Research_Data_Factors`$annual$`annual_factors:_january-december` %>%
left_join(FFdata$`x_F-F_Momentum_Factor`$annual$`january-december` ,by="date") %>%
left_join(FFdata$`x_F-F_LT_Reversal_Factor`$annual$`january-december`,by="date") %>%
left_join(FFdata$`x_F-F_ST_Reversal_Factor`$annual$`january-december` ,by="date")
FFfive %>% head()
#> # A tibble: 6 × 8
#> date Mkt.RF SMB HML RF Mom LT_Rev ST_Rev
#> <yearmon> <dbl> <dbl> <dbl> <dbl> <dbl> <dbl> <dbl>
#> 1 Dez 1927 29.5 -2.04 -4.54 3.12 24.1 NA -17.7
#> 2 Dez 1928 35.4 4.51 -6.17 3.56 29.1 NA -10.8
#> 3 Dez 1929 -19.5 -30.7 11.7 4.75 21.1 NA -15.0
#> 4 Dez 1930 -31.2 -5.17 -11.5 2.41 25.7 NA -0.86
#> 5 Dez 1931 -45.1 3.7 -14.0 1.07 23.8 -3.24 24.2
#> 6 Dez 1932 -9.39 4.4 11.1 0.96 -21.8 9.27 30.5FFfive %>%
pivot_longer(Mkt.RF:ST_Rev,names_to="FFVar",values_to="FFret") %>% mutate(FFret=FFret/100,date=as.Date(date)) %>%
filter(date>="1960-01-01",!FFVar=="RF") %>% group_by(FFVar) %>% arrange(FFVar,date) %>%
mutate(FFret=ifelse(date=="1960-01-01",1,FFret),FFretv=cumprod(1+FFret)-1) %>%
ggplot(aes(x=date,y=FFretv,col=FFVar,type=FFVar)) + geom_line(lwd=1.2) + scale_y_log10() +
labs(title="FF5 Factors plus Momentum", subtitle="Cumulative wealth plots",ylab="cum. returns") +
scale_colour_viridis_d("FFvar") +
theme_bw() + theme(legend.position="bottom")
#> Warning in self$trans$transform(x): NaNs wurden erzeugt
#> Warning: Transformation introduced infinite values in continuous y-axis
#> Warning: Removed 11 row(s) containing missing values (geom_path).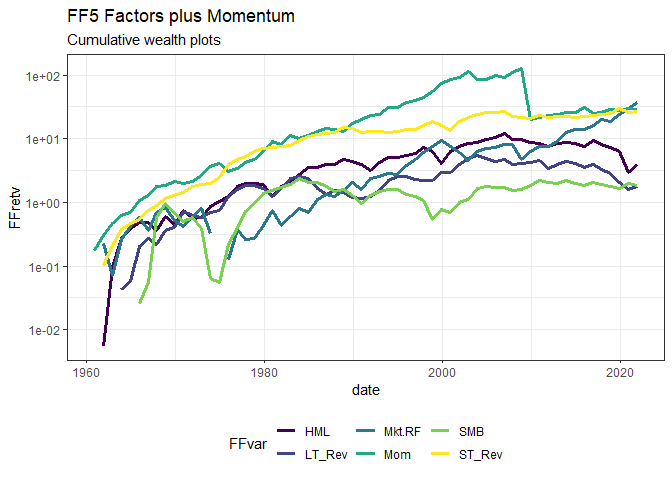
I am grateful to Kenneth French for providing all this great research data on his website! Our lives would be so much harder without this boost for productivity. I am also grateful for the kind conversation with Kenneth with regard to this package: He appreciates my work on this package giving others easier access to his data sets!