This package allows you to download parasite rate data (Plasmodium falciparum and P. vivax), survey occurrence data of the 41 dominant malaria vector species, and modelled raster outputs from the Malaria Atlas Project.
More details and example analyses can be found in the [published paper)[(https://malariajournal.biomedcentral.com/articles/10.1186/s12936-018-2500-5).
The data can be explored at https://malariaatlas.org/explorer/#/explorer.
listData() retrieves a list of available data to
download.
Use:
listData(datatype = “pr points”) OR listPoints(sourcedata = “pr points”) to see for which countries PR survey point data can be downloaded.
listData(datatype = “vector points”) OR listPoints(sourcedata = “vector points”) to see for which countries Vector survey data can be downloaded.
use listData(datatype = “rasters”) OR listRaster() to see rasters available to download.
use listData(datatype = “shape”) OR listShp() to see shapefiles available to download.
listData(datatype = "pr points")listData(datatype = "vector points")listData(datatype = "raster")listData(datatype = "shape")isAvailable_pr confirms whether or not PR survey point
data is available to download for a specified country.
Check whether PR data is available for Madagascar:
isAvailable_pr(country = "Madagascar")## Confirming availability of PR data for: Madagascar...## PR points are available for Madagascar.Check whether PR data is available for the United States of America
isAvailable_pr(ISO = "USA")## Confirming availability of PR data for: USA...## Error in isAvailable_pr(ISO = "USA"): Specified location not found, see below comments:
##
## Data not found for 'USA', did you mean UGA OR SAU?isAvailable_vec confirms whether or not vector survey
point data is available to download for a specified country.
Check whether vector data is available for Myanmar:
isAvailable_vec(country = "Myanmar")## Confirming availability of Vector data for: Myanmar...## Vector points are available for Myanmar.getPR() downloads all publicly available PR data points
for a specified country and plasmodium species (Pf, Pv or BOTH) and
returns this as a dataframe with the following format:
MDG_pr_data <- getPR(country = "Madagascar", species = "both")## Observations: 538
## Variables: 28
## $ dhs_id <lgl> NA, NA, NA, NA, NA, NA, NA, NA, NA, NA…
## $ site_id <int> 6221, 6021, 15070, 15795, 7374, 13099,…
## $ site_name <fct> Andranomasina, Andasibe, Ambohimarina,…
## $ latitude <dbl> -18.7170, -19.8340, -18.7340, -19.7699…
## $ longitude <dbl> 47.4660, 47.8500, 47.2520, 46.6870, 46…
## $ rural_urban <fct> UNKNOWN, UNKNOWN, UNKNOWN, UNKNOWN, UN…
## $ country <fct> Madagascar, Madagascar, Madagascar, Ma…
## $ country_id <fct> MDG, MDG, MDG, MDG, MDG, MDG, MDG, MDG…
## $ continent_id <fct> Africa, Africa, Africa, Africa, Africa…
## $ month_start <int> 1, 3, 1, 7, 4, 1, 1, 7, 4, 7, 11, 4, 9…
## $ year_start <int> 1987, 1987, 1987, 1995, 1986, 1987, 19…
## $ month_end <int> 1, 3, 1, 8, 6, 1, 1, 8, 4, 8, 11, 6, 9…
## $ year_end <int> 1987, 1987, 1987, 1995, 1986, 1987, 19…
## $ lower_age <int> 0, 0, 0, 2, 7, 0, 0, 2, 6, 2, 2, 7, 0,…
## $ upper_age <int> 99, 99, 99, 9, 22, 99, 99, 9, 12, 9, 9…
## $ examined <int> 50, 246, 50, 50, 119, 50, 50, 50, 20, …
## $ positive <dbl> 7.5, 126.0, 2.5, 6.0, 37.0, 13.5, 4.5,…
## $ pr <dbl> 0.1500, 0.5122, 0.0500, 0.1200, 0.3109…
## $ species <chr> "P. falciparum", "P. falciparum", "P. …
## $ method <fct> Microscopy, Microscopy, Microscopy, Mi…
## $ rdt_type <fct> , , , , , , , , , , , , , , , , , , , …
## $ pcr_type <lgl> NA, NA, NA, NA, NA, NA, NA, NA, NA, NA…
## $ malaria_metrics_available <fct> true, true, true, true, true, true, tr…
## $ location_available <fct> true, true, true, true, true, true, tr…
## $ permissions_info <fct> , , , , , , , , , , , , , , , , , , , …
## $ citation1 <fct> "Lepers, J.P., Ramanamirija, J.A., And…
## $ citation2 <fct> , , , , , , , , , , , , , , , , , , , …
## $ citation3 <lgl> NA, NA, NA, NA, NA, NA, NA, NA, NA, NA…autoplot.pr.points configures autoplot method to enable
quick mapping of the locations of downloaded PR points.
autoplot(MDG_pr_data)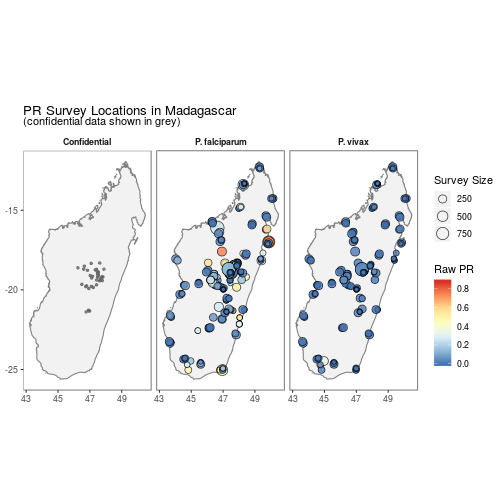
A version without facetting is also available.
autoplot(MDG_pr_data,
         facet = FALSE)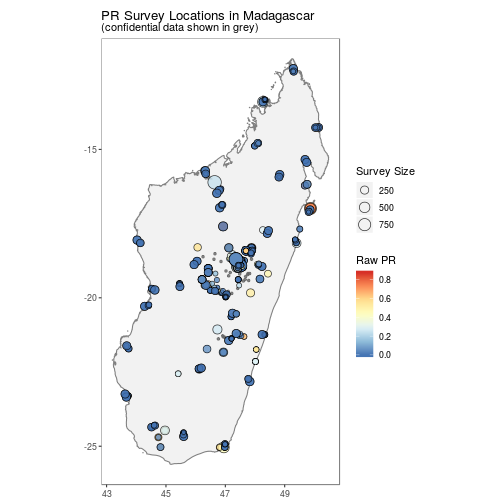
getVecOcc() downloads all publicly available Vector
survey points for a specified country and and returns this as a
dataframe with the following format:
MMR_vec_data <- getVecOcc(country = "Myanmar")## Observations: 2,866
## Variables: 24
## $ site_id <int> 30243, 30243, 30243, 30243, 1000000072, 100000007…
## $ latitude <dbl> 16.257, 16.257, 16.257, 16.257, 17.350, 17.380, 1…
## $ longitude <dbl> 97.725, 97.725, 97.725, 97.725, 96.041, 96.037, 9…
## $ country <fct> Myanmar, Myanmar, Myanmar, Myanmar, Myanmar, Myan…
## $ country_id <fct> MMR, MMR, MMR, MMR, MMR, MMR, MMR, MMR, MMR, MMR,…
## $ continent_id <fct> Asia, Asia, Asia, Asia, Asia, Asia, Asia, Asia, A…
## $ month_start <int> 2, 3, 8, 9, 5, 5, 5, 5, 5, 5, 5, 5, 5, 5, 5, 5, 5…
## $ year_start <int> 1998, 1998, 1998, 1998, 1998, 1998, 1998, 1998, 1…
## $ month_end <int> 2, 3, 8, 9, 3, 3, 3, 3, 3, 3, 3, 3, 3, 3, 3, 3, 3…
## $ year_end <int> 1998, 1998, 1998, 1998, 2000, 2000, 2000, 2000, 2…
## $ anopheline_id <int> 17, 17, 17, 17, 50, 49, 17, 51, 11, 4, 15, 1, 35,…
## $ species <fct> "Anopheles dirus species complex", "Anopheles dir…
## $ species_plain <fct> Anopheles dirus, Anopheles dirus, Anopheles dirus…
## $ id_method1 <fct> unknown, unknown, unknown, unknown, morphology, m…
## $ id_method2 <fct> , , , , , , , , , , , , , , , , , , , , , , , ,
## $ sample_method1 <fct> man biting, man biting, man biting, man biting, m…
## $ sample_method2 <fct> animal baited net trap, animal baited net trap, a…
## $ sample_method3 <fct> , , , , animal baited net trap, animal baited net…
## $ sample_method4 <fct> , , , , house resting inside, house resting insid…
## $ assi <fct> , , , , , , , , , , , , , , , , , , , , , , , ,
## $ citation <fct> "Oo, T.T., Storch, V. and Becker, N. (2003). <b>…
## $ geom <fct> POINT (16.257 97.725), POINT (16.257 97.725), POI…
## $ time_start <fct> 1998-02-01, 1998-03-01, 1998-08-01, 1998-09-01, 1…
## $ time_end <fct> 1998-02-01, 1998-03-01, 1998-08-01, 1998-09-01, 2…autoplot.vector.points configures autoplot method to
enable quick mapping of the locations of downloaded vector points.
autoplot(MMR_vec_data)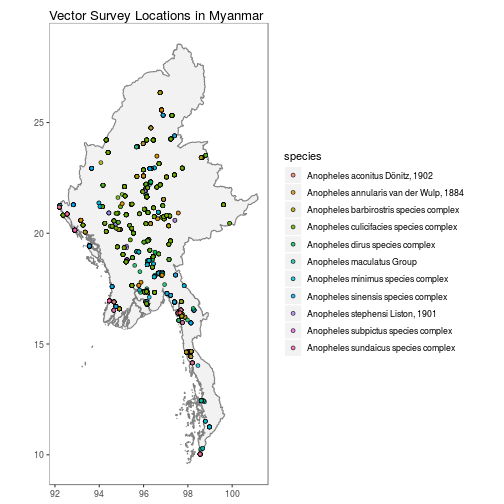
N.B. Facet-wrapped option is also available for species stratification.
autoplot(MMR_vec_data,
         facet = TRUE)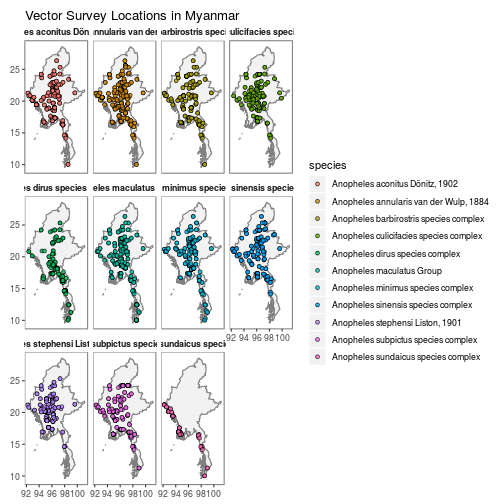
getShp() downloads a shapefile for a specified country
(or countries) and returns this as either a spatialPolygon or data.frame
object.
MDG_shp <- getShp(ISO = "MDG", admin_level = c("admin0", "admin1"))## Formal class 'SpatialPolygonsDataFrame' [package "sp"] with 5 slots
## ..@ data :'data.frame': 23 obs. of 16 variables:
## .. ..$ iso : Factor w/ 86 levels "AFG","AGO","BDI",..: 43 43 43 43 43 43 43 43 43 43 ...
## .. ..$ admn_level : num [1:23] 0 1 1 1 1 1 1 1 1 1 ...
## .. ..$ name_0 : Factor w/ 86 levels "Afghanistan",..: 42 42 42 42 42 42 42 42 42 42 ...
## .. ..$ id_0 : num [1:23] 1e+07 1e+07 1e+07 1e+07 1e+07 ...
## .. ..$ type_0 : Factor w/ 1 level "Country": 1 1 1 1 1 1 1 1 1 1 ...
## .. ..$ name_1 : chr [1:23] NA "Androy" "Anosy" "Atsimo Andrefana" ...
## .. ..$ id_1 : num [1:23] NA 1e+07 1e+07 1e+07 1e+07 ...
## .. ..$ type_1 : chr [1:23] NA "Region" "Region" "Region" ...
## .. ..$ name_2 : chr [1:23] NA NA NA NA ...
## .. ..$ id_2 : num [1:23] NA NA NA NA NA NA NA NA NA NA ...
## .. ..$ type_2 : chr [1:23] NA NA NA NA ...
## .. ..$ name_3 : logi [1:23] NA NA NA NA NA NA ...
## .. ..$ id_3 : logi [1:23] NA NA NA NA NA NA ...
## .. ..$ type_3 : logi [1:23] NA NA NA NA NA NA ...
## .. ..$ source : Factor w/ 33 levels "ALHASAN Systems Private Limited 2017",..: 17 17 17 17 17 17 17 17 17 17 ...
## .. ..$ country_level: chr [1:23] "MDG_0" "MDG_1" "MDG_1" "MDG_1" ...
## ..@ polygons :List of 23
## .. ..$ :Formal class 'Polygons' [package "sp"] with 5 slots
## .. ..$ :Formal class 'Polygons' [package "sp"] with 5 slots
## .. ..$ :Formal class 'Polygons' [package "sp"] with 5 slots
## .. ..$ :Formal class 'Polygons' [package "sp"] with 5 slots
## .. ..$ :Formal class 'Polygons' [package "sp"] with 5 slots
## .. ..$ :Formal class 'Polygons' [package "sp"] with 5 slots
## .. ..$ :Formal class 'Polygons' [package "sp"] with 5 slots
## .. ..$ :Formal class 'Polygons' [package "sp"] with 5 slots
## .. ..$ :Formal class 'Polygons' [package "sp"] with 5 slots
## .. ..$ :Formal class 'Polygons' [package "sp"] with 5 slots
## .. ..$ :Formal class 'Polygons' [package "sp"] with 5 slots
## .. ..$ :Formal class 'Polygons' [package "sp"] with 5 slots
## .. ..$ :Formal class 'Polygons' [package "sp"] with 5 slots
## .. ..$ :Formal class 'Polygons' [package "sp"] with 5 slots
## .. ..$ :Formal class 'Polygons' [package "sp"] with 5 slots
## .. ..$ :Formal class 'Polygons' [package "sp"] with 5 slots
## .. ..$ :Formal class 'Polygons' [package "sp"] with 5 slots
## .. ..$ :Formal class 'Polygons' [package "sp"] with 5 slots
## .. ..$ :Formal class 'Polygons' [package "sp"] with 5 slots
## .. ..$ :Formal class 'Polygons' [package "sp"] with 5 slots
## .. ..$ :Formal class 'Polygons' [package "sp"] with 5 slots
## .. ..$ :Formal class 'Polygons' [package "sp"] with 5 slots
## .. ..$ :Formal class 'Polygons' [package "sp"] with 5 slots
## ..@ plotOrder : int [1:23] 1 4 17 15 14 3 8 7 20 12 ...
## ..@ bbox : num [1:2, 1:2] 43.2 -25.6 50.5 -11.9
## .. ..- attr(*, "dimnames")=List of 2
## ..@ proj4string:Formal class 'CRS' [package "sp"] with 1 slotautoplot.MAPshp configures autoplot method to enable
quick mapping of downloaded shapefiles.
MDG_shp <- as.MAPshp(MDG_shp)
autoplot(MDG_shp)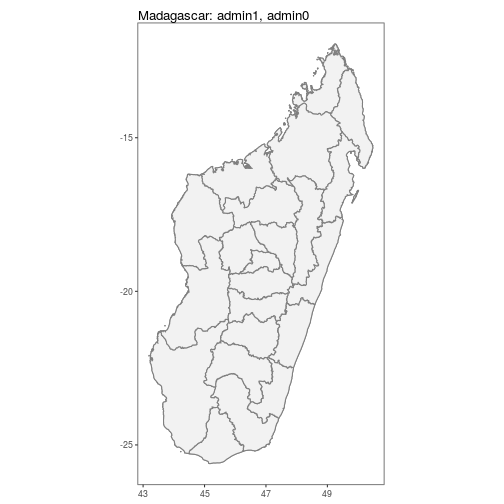
N.B. Facet-wrapped option is also available for species stratification.
autoplot(MDG_shp,
         facet = TRUE,
         map_title = "Example of facetted shapefiles.")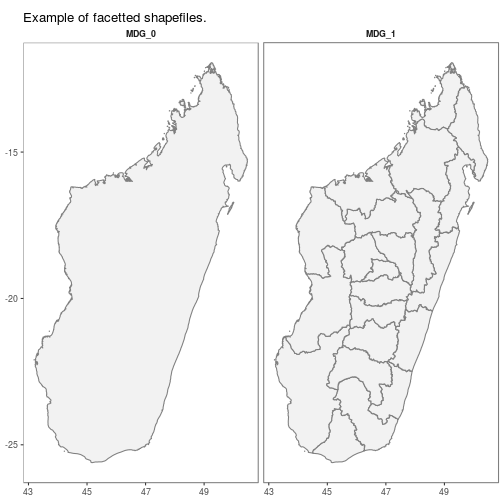
getRaster()downloads publicly available MAP rasters for
a specific surface & year, clipped to a given bounding box or
shapefile
MDG_shp <- getShp(ISO = "MDG", admin_level = "admin0")
MDG_PfPR2_10 <- getRaster(surface = "Plasmodium falciparum PR2-10", shp = MDG_shp, year = 2013)
N.B. to use downloaded rasters and shapefiles directly with autoplot, use as.MAPraster() and as.MAPshp() to convert these to data.frames. Alternatively autoplot_MAPraster() will work directly with RasterLayer, RasterStack or RasterBrick objects downloaded with getRaster().
autoplot.MAPraster&autoplot_MAPrasterconfigures
autoplot method to enable quick mapping of downloaded rasters.
MDG_PfPR2_10_df <- as.MAPraster(MDG_PfPR2_10)
MDG_shp_df <- as.MAPshp(MDG_shp)
p <- autoplot(MDG_PfPR2_10_df, shp_df = MDG_shp_df)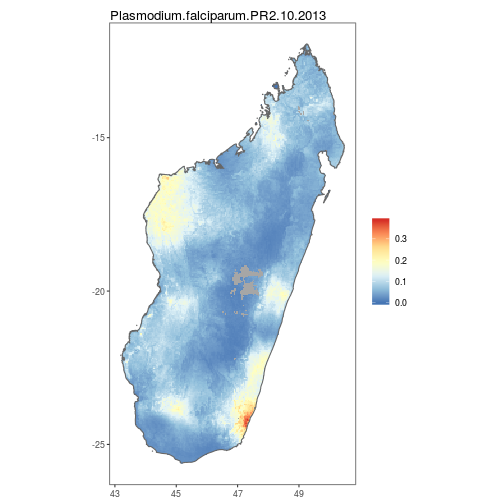
By using the above tools along with ggplot, simple comparison figures can be easily produced.
MDG_shp <- getShp(ISO = "MDG", admin_level = "admin0")
MDG_shp_df <- as.MAPshp(MDG_shp)
MDG_PfPR2_10 <- getRaster(surface = "Plasmodium falciparum PR2-10", shp = MDG_shp, year = 2013)
MDG_PfPR2_10_df <- as.MAPraster(MDG_PfPR2_10)

p <- autoplot(MDG_PfPR2_10_df, shp_df = MDG_shp_df, printed = FALSE)

pr <- getPR(country = c("Madagascar"), species = "Pf")
p[[1]] +
geom_point(data = pr[pr$year_start==2013,], aes(longitude, latitude, fill = positive / examined, size = examined), shape = 21)+
scale_size_continuous(name = "Survey Size")+
 scale_fill_distiller(name = "PfPR", palette = "RdYlBu")+
 ggtitle("Raw PfPR Survey points\n + Modelled PfPR 2-10 in Madagascar in 2013")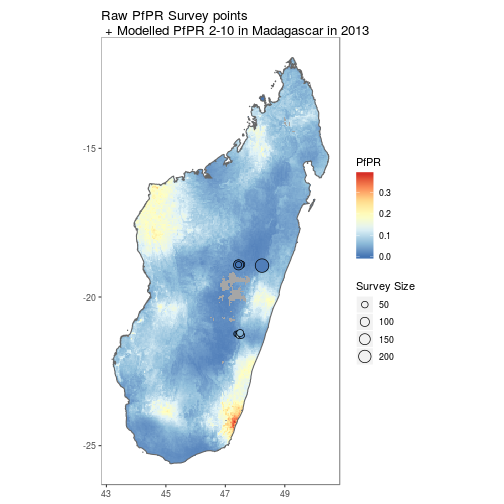
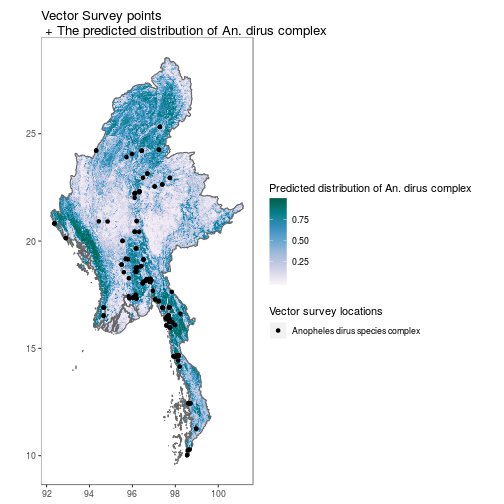
Similarly for vector survey data
MMR_shp <- getShp(ISO = "MMR", admin_level = "admin0")
MMR_shp_df <- as.MAPshp(MMR_shp)
MMR_An_dirus <- getRaster(surface = "Anopheles dirus species complex", shp = MMR_shp)
MMR_An_dirus_df <- as.MAPraster(MMR_An_dirus)

p <- autoplot(MMR_An_dirus_df, shp_df = MMR_shp_df, printed = FALSE)

vec <- getVecOcc(country = c("Myanmar"), species = "Anopheles dirus")
p[[1]] +
geom_point(data = vec, aes(longitude, latitude, colour = species))+
  scale_colour_manual(values = "black", name = "Vector survey locations")+
 scale_fill_distiller(name = "Predicted distribution of An. dirus complex", palette = "PuBuGn", direction = 1)+
 ggtitle("Vector Survey points\n + The predicted distribution of An. dirus complex")