![]()
![]()

The unikn package provides useful color functions — by defining dedicated colors and color palettes, and commands for finding, changing, viewing, and using them — and styled text elements (e.g., for marking, underlining, or plotting colored titles) in R. The package’s pre-defined range of colors and text decoration functions is based on the corporate design of the University of Konstanz (see link for details), but can easily be adapted and extended to other purposes or institutions.
Institutions devise corporate designs (CDs) for creating and maintaining a consistent impression in presentations and publications. Even when writing an article or thesis, it makes sense to define some graphical elements (e.g., a color scheme) and use them consistently throughout the report.
The unikn package facilitates the use of corporate design elements for R users. It currently contains dedicated colors and color palettes of the University of Konstanz, plus many additional color palettes from other institutions. In addition, unikn provides a range of color functions that make it easy to define, modify, find, and use colors in R. While this renders the use of default specifications simple and straightforward, experienced users can apply the tools in a flexible and creative fashion (e.g., for designing new color palettes and using them in scientific visualizations).
The unikn package currently provides five types of objects and functions:
Pre-defined colors and color
palettes (e.g., Seeblau and
pal_unikn);
Functions for viewing and comparing colors
(seecol()), for using or changing color
palettes (usecol()), and for demonstrating
color palettes (demopal());
Functions for creating new color palettes
(newpal()), for finding similar colors
(simcol()), and for searching color names
(grepal());
Functions for plotting graphical objects (e.g., boxes and frames);
Functions for plotting styled text elements
(e.g., highlighting and underlining text).
Essentially, the unikn package began by defining some colors, but has now grown into a toolbox for addressing color- and plotting-related tasks in R. As we had fun creating it, we hope that you enjoy using it as well!
The latest release of unikn is available from CRAN at https://CRAN.R-project.org/package=unikn:
install.packages('unikn')  # install from CRAN client
library('unikn')           # loads the package
The current development version can be installed from its GitHub repository at https://github.com/hneth/unikn/:
# install.packages('devtools')  # install pkg
devtools::install_github('hneth/unikn')The colors of unikn belong to two categories of color palettes:
16 palettes implementing the colors of the University of Konstanz’s corporate design
52 additional color palettes from various academic institutions
Originally, the unikn package primarily provided the 16 color palettes of the University of Konstanz:
seecol("all_unikn")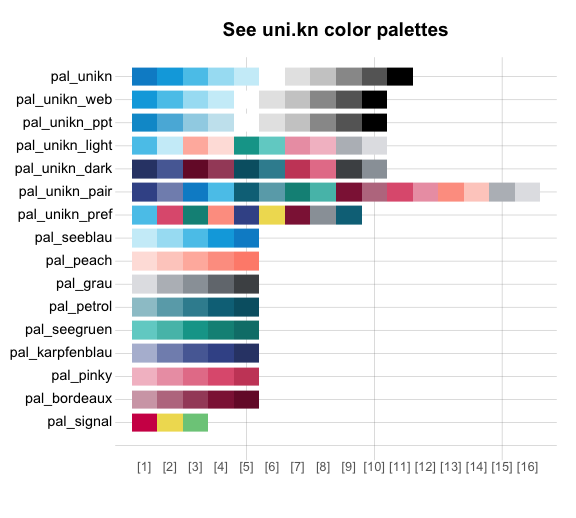
In 2014, the University of
Konstanz introduced a highly recognizable CD. Its key component is
the ubiquitous use of a Seeblau color and a corresponding
color palette that blends various shades of Seeblau (in
boxes, lines, and other graphical elements) with text (in
black-and-white).
The default unikn color palette
pal_unikn combines shades of pal_seeblau and
pal_grau with the base R colors “white” and “black” into a
diverging, symmetrical palette (of 11 colors):
seecol(pal_unikn)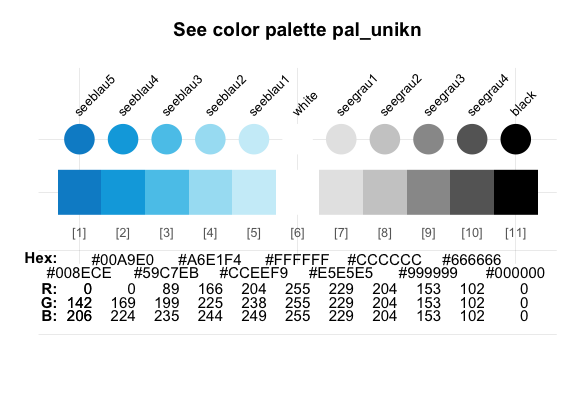
A shorter version (with 10 colors) and an alternative (with more
muted colors for PowerPoint presentations) are provided
as pal_unikn_web and pal_unikn_ppt,
respectively. (Inspect seecol("unikn_basic") or see the corporate
design specifications for details.)
Several more specialized color palettes combine the elements of nine
color hues. The preferred colors are contained in
palette pal_unikn_pref:
seecol(pal_unikn_pref)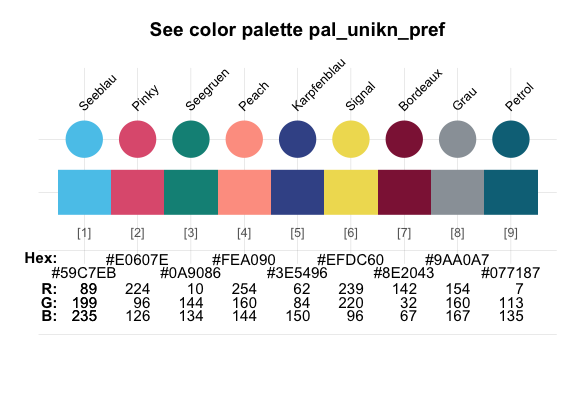
Each distinct hue is exported as a named color (e.g.,
Pinky) and a corresponding gradient color palette (e.g.,
pal_pinky). (Inspect seecol("grad_all") or the
Excel file Colours
for complex graphics for details.)
unikn exports these color palettes as data frames that can be accessed by number, value, or name:
# Accessing colors from palettes:
pal_unikn              # color palette of 11 colors
pal_unikn[3]           # preferred (named) color 3
pal_unikn[[3]]         # color value 3: #59C7EB"
pal_unikn["seeblau3"] # color by nameIn addition to the 16 specific color palettes of the University of Konstanz, unikn currently provides color palettes of the following institutions:
caltech_pal_1, caltech_pal_2,
caltech_pal_3eth_pal_1,
eth_pal_2, eth_pal_3fu_pal_0, fu_pal_1,
fu_pal_2, fu_pal_3hu_pal_1, hu_pal_2lmu_pal_1, lmu_pal_2,
lmu_pal_3mpg_paluni_bonn_1, uni_bonn_2uni_freiburg_0, uni_freiburg_1,
uni_freiburg_2,uni_freiburg_br,
uni_freiburg_blue, uni_freiburg_grey,
uni_freiburg_info)uni_goettingen_1, uni_goettingen_2,
uni_goettingen_3uni_hamburg_1, uni_hamburg_2uni_jena_1, uni_jena_2uni_kiel_1, uni_kiel_2uni_koeln_1, uni_koeln_2uni_konstanz_1, uni_konstanz_2uni_mannheim_1, uni_mannheim_2uni_princeton_0, uni_princeton_1,
uni_princeton_2uni_regensburg_1,
uni_regensburg_2, uni_regensburg_3uni_ulm_1, uni_ulm_2rpi_pal_1, rpi_pal_2,
rpi_pal_3rptu_pal# Inspect additional/alternative color palettes:
seecol("add")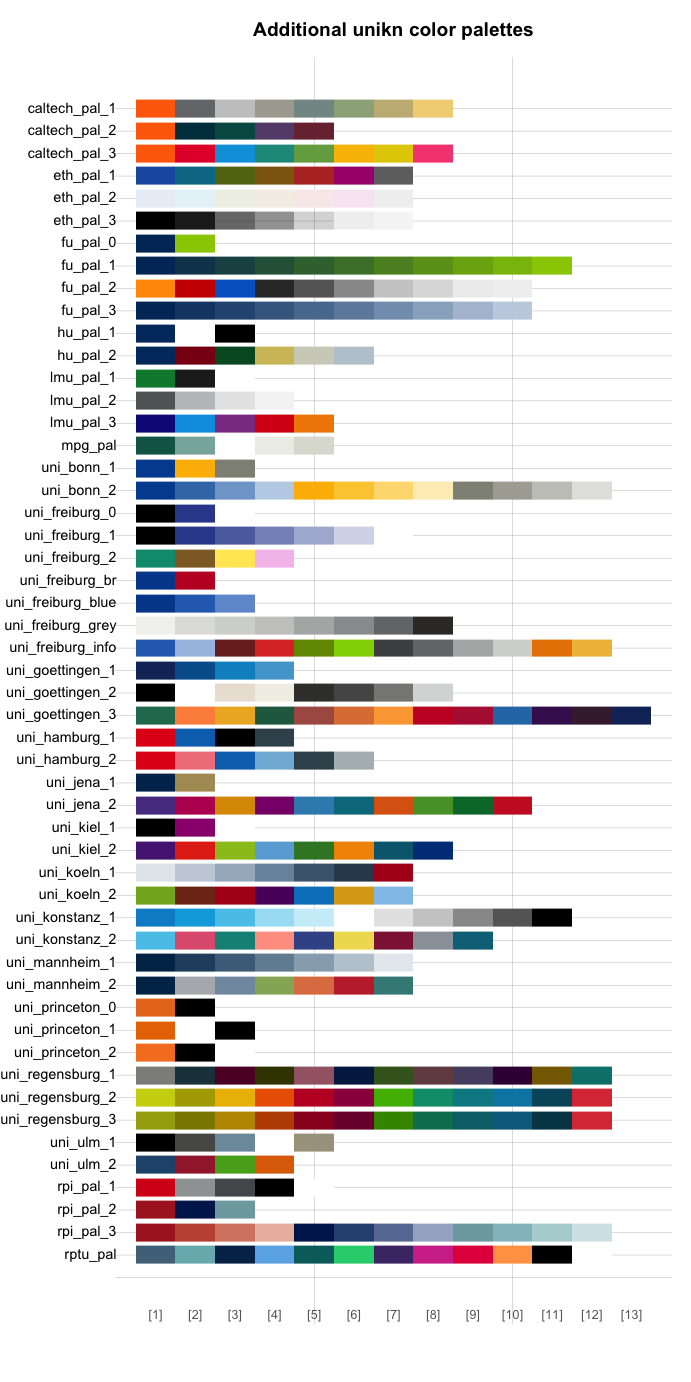
These 52 palettes are exported (as named vectors), documented (to credit their contributors and sources), and can easily be used and modified by the R community (e.g., in visualizations).
We are currently expanding the range of color palettes from other institutions:
Collecting color palettes
If so, please let us know (e.g., by posting on this GitHub issue)!
We collect color palettes from other institutions to make them available to R users in future versions of unikn.
To enable us to verify and provide appropriate credit to your contributions, please provide us with the following information:
newpal() command creating your
color palette),We’re looking forward to your inputs and contributions!
Beyond defining colors and color palettes, the unikn package provides a range of tools for viewing and manipulating colors:
Two main functions — seecol() and
usecol() — provide a simple interface for viewing
and using color palettes.
Additional color functions (i.e., simcol(),
grepal(), newpal(), shades_of(),
or ac()) provide auxiliary functionality (for finding
similar colors and color names, creating new color palettes and color
gradients, or adjusting transparency).
seecol()The seecol() function enables either inspections of an
individual color palette or comparisons between multiple color
palettes.
Using seecol() on an individual color palette provides a
quick overview over its colors and details:
# Inspect an individual color palette:
seecol(pal = eth_pal_1,                    # a color palette / list of palettes / keyword
       col_brd = "white", lwd_brd = 5,     # color and width of borders
main = "Colors of the ETH Zurich") # plot title 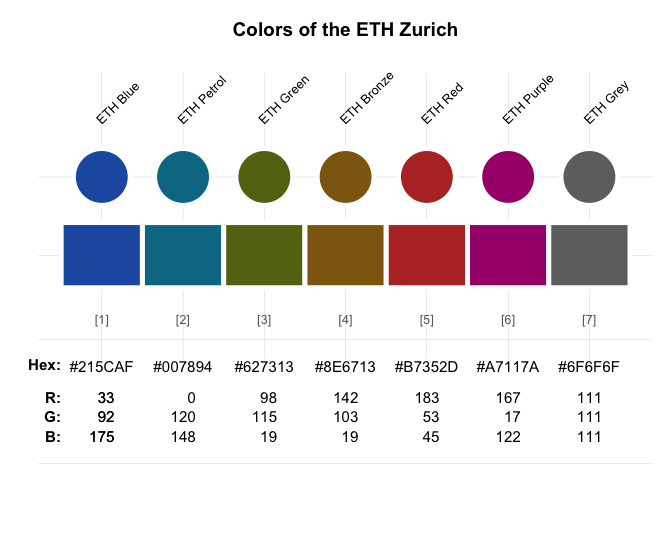
When seecol() is used with a recognized keyword or a
list of color palettes, the function displays a comparison between them.
When only some colors of a color palette are requested, the
seecol() and usecol() functions provide
reasonable subsets of a unikn palette:
# Compare a list of (scaled) color palettes:
seecol(pal = "grad_all", n = 3,
       col_brd = "black", lwd_brd = .5,
       main = "Color gradient palettes (scaled to n = 3)")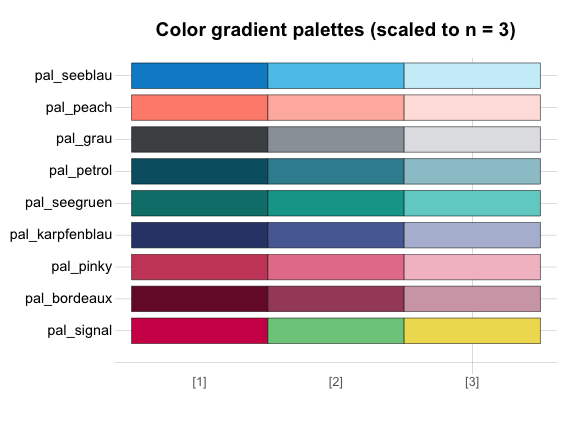
usecol()Colors and color palettes in R come in various types (e.g., as named
colors, RGB values or Hex codes) and forms (e.g., as data frames or
vectors). The usecol() function provides a generic wrapper
for changing (e.g., mixing and re-scaling) and using color palettes.
This allows using colors in base R and most other R
packages. For instance, we can easily use colors in combination with
barplot() function of the
grDevices package:# Mix some colors into a new palette:
my_pal <- usecol(c(Seeblau, "white", Pinky), n = 9)
# Use color palette:
barplot(1/sqrt(1:9), col = my_pal)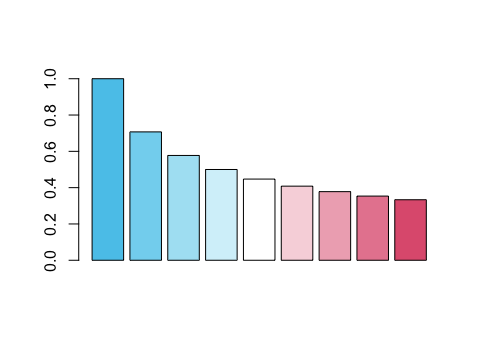
image() function of the graphics
package:# Data:
x <- y <- seq(-4 * pi, 4 * pi, len = 15)
r <- sqrt(outer(x^2, y^2, "+"))
# Mix a palette with a named color:
my_col <- usecol(c(Seegruen, "white"), n = 7)
# Image:
image(z = cos(r^2) * exp(-r/10),
col = my_col, axes = FALSE)
ggplot() function of the ggplot2
package:# Mix a color gradient:
my_col <- usecol(c(Bordeaux, "white", Petrol), n = 50)
# Plot (with ggplot2):
library(ggplot2)
ggplot(my_data, aes(x = X, y = Y, fill = Group)) +
geom_area() +
scale_fill_manual(values = my_col) +
theme_void() +
theme(legend.position = "none")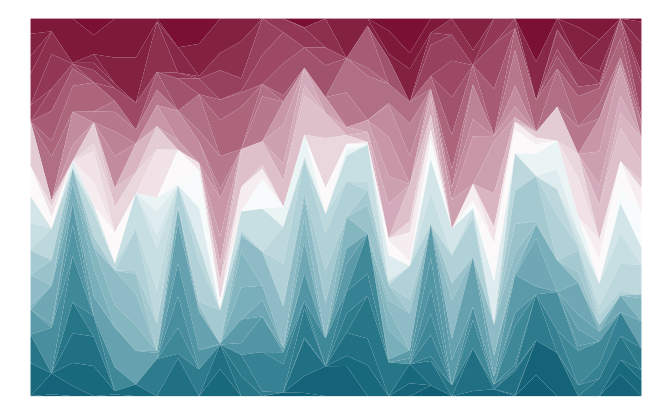
The demopal() function provides a quick illustration of
a pre-defined or modified color palette:
demopal(usecol(uni_princeton_1, n = 7),  # use a modified color palette
        type = "curve", seed = 2)        # reproducible randomness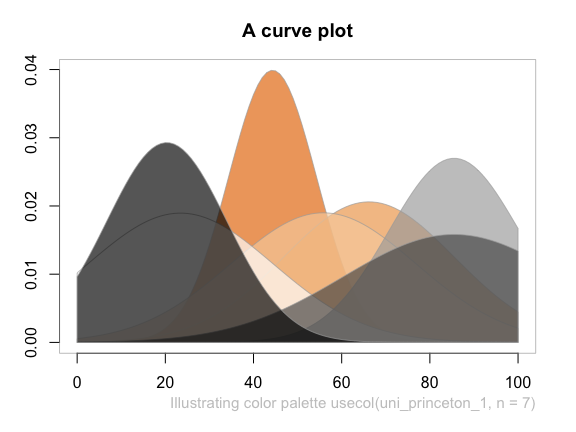
newpal()The newpal() function allows creating new color palettes
(as data frames or vectors, with optional color names). Whereas
unikn was developed in an academic context, color
palettes for other entities and purposes can easily be created. For
instance, let’s define a color palette of the well-known Google logo in 3 steps:
Choose some colors (from named R colors, or by RGB/HEX/HCL values, e.g., from sites like https://www.schemecolor.com).
Define the colors (and optional color names) as R vectors (of type character).
Use the newpal() command to define a new color
palette.
We can now use the new palette in visualizations (e.g., inspect it
with the seecol() function, use it in visualizations, or
modify it further with the usecol() function):
# 1. Choose colors:
# Google logo colors (from <https://www.schemecolor.com/google-logo-colors.php>)

# 2. Define colors and color names (as vectors):
color_google <- c("#4285f4", "#34a853", "#fbbc05", "#ea4335")
names_google <- c("blueberry", "sea green", "selective yellow", "cinnabar")

# 3. Define color palette:
pal_google <- newpal(color_google, names_google)

# Inspect color palette:
seecol(pal_google,
       col_brd = "white", lwd_brd = 8,
       main = "Colors of Google")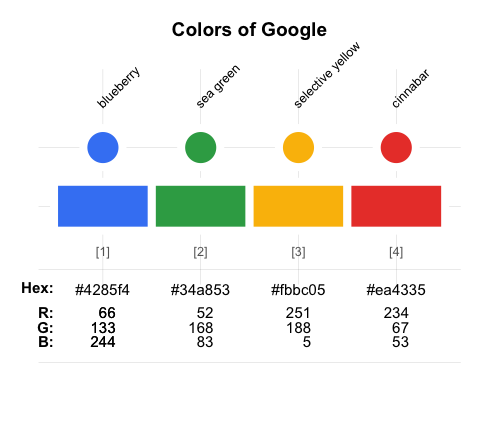
See the vignette on Institutional colors for additional examples of creating color palettes.
When creating visualizations, we often face two search situations:
The simcol() and grepal() functions of
unikn address both situations.
simcol()uni_princeton_0 palette?simcol(col_target = uni_princeton_0["Princeton orange"], tol = 30)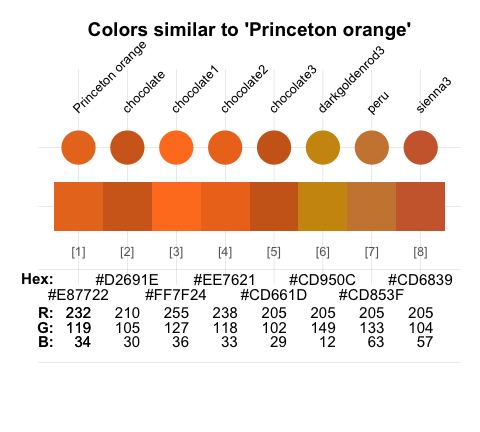
#> Princeton orange        chocolate       chocolate1       chocolate2
#>        "#E87722"      "chocolate"     "chocolate1"     "chocolate2"
#>       chocolate3   darkgoldenrod3             peru          sienna3
#>     "chocolate3" "darkgoldenrod3"           "peru"        "sienna3"
By default, simcol() considers all unique named
colors() of R, but its search range can be adjusted by its
col_candiates, tol, and distinct
arguments.
grepal()The grepal() function allows finding colors by matching
their name to a pattern.
Specifically, grepal(pattern, x) searches a color
palette x (i.e., a vector of color names or data frame of
named colors) for elements that match a pattern and returns
those elements (colors) that match the pattern. The pattern
can be a regular expression.
By default, grepal() searches the 657 named colors
provided by colors() in base R. To make
the grepal() more flexible, its
pattern argument can use regular expressions:
# Find colors matching a pattern:
deep_purple <- grepal(pattern = "deep|purple", plot = FALSE)

# See color palette:
seecol(deep_purple,
       col_brd = "white", lwd_brd = 2,
       main = "Finding 'deep' or 'purple' colors")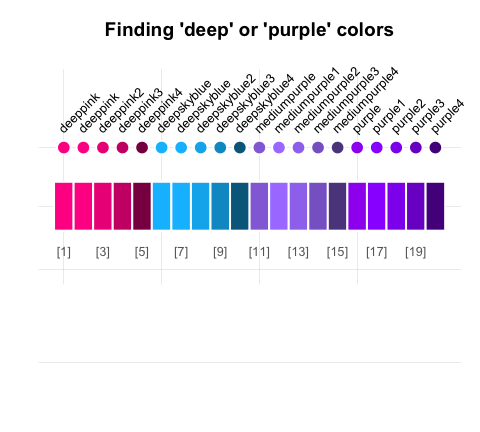
Providing a list of color palettes to the pal argument
of seecol() allows comparing multiple color palettes:
# Find colors matching some term(s):
olives  <- grepal("olive", plot = FALSE)
oranges <- grepal("orange", plot = FALSE)

# See color palettes:
seecol(pal = list(olives, oranges),
       pal_names = c("olives", "oranges"),
       main = "Comparing olives with oranges")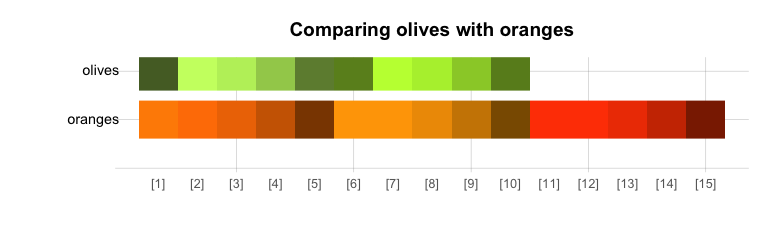
See the vignette on Colors and color functions and Color recipes for additional examples.
Beyond colors and color functions, unikn provides
functions for plotting graphical elements (like boxes) and styled text
elements (with lines or background decorations). By default, the
text-decoration functions assume that you want to add styled text to an
existing plot, unless the new_plot argument specifies a
type of plot to be generated. As the use of these functions is explained
in detail in the vignette on Text boxes and
decorations, we only provide some examples here.
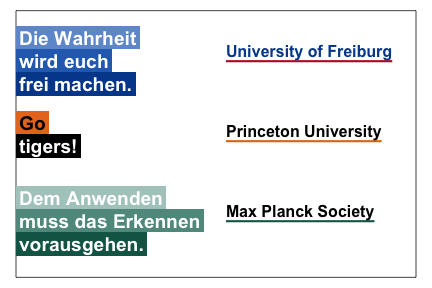
The mark() function allows emphasizing text by plotting
it with colored background (to provide the functionality of
“Markieren”):
mark(labels = c("Markieren", "ist ein Bestandteil", "von Studieren."),
     x = 0, y = .8, y_layout = .03, cex = 1.5, new_plot = "slide")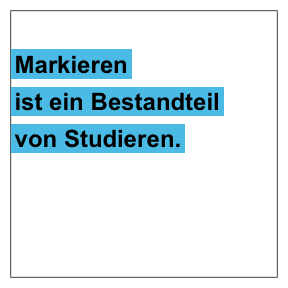
The uline() function allows emphasizing text by plotting
it with colored underlining (to provide the functionality of
“Unterstreichen”):
uline(labels = c("Linear", "Authentic", "Flexible", "Open", "Practical"),
      x = .05, y = .9, y_layout = "even", cex = 1.1, font = 2, new_plot = "slide")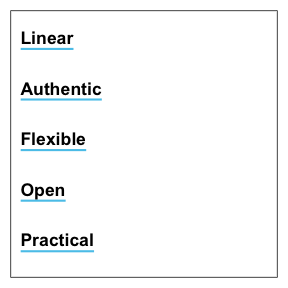
The post() function allows adding text to a rectangular
xbox (to provide the functionality of “Merken”):
xbox(col = usecol(pal_seeblau[[5]]), dim = c(2, 2))
post(labels = c("Für eine", "Kultur der", "Kreativität"), x = .1, y = .8, cex = 1.4, font = 2)
The color and font parameters can be adjusted to obtain different looks:
post(labels = c("creative.", "together"), new_plot = "xbox",
     y_layout = .02, cex = 2, font = c(1, 3),
     col_bg = pal_seegruen[[1]], col = c(Petrol, Pinky))
The heading() function is a convenient wrapper around
mark:
heading(labels = c("pa-", "ra-", "die-", "sisch"))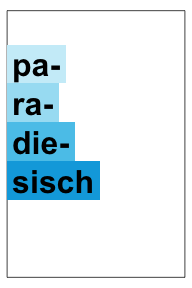
Finally, the url_unikn() function allows formatting URLs
the uni.kn way:
my_url <- url_unikn("https://www.uni-konstanz.de/")  # input URL as copied from web browser

post(labels = my_url, x = .2, y = .1, font = 4, new_plot = "xbox")
All unikn color palettes and user-generated color
palette (e.g., defined by newpal() or
usecol()) can be used for graphical annotations. For
example:
pal_google (defined
above):
See the vignette on Text boxes and decorations for additional examples.
Please note the following caveats:
Plotting text (i.e., graphically rendering characters) is rarely a good idea. It typically doesn’t scale (when changing the size of images) and cannot be recognized automatically (e.g., copied, indexed, or scraped). Hence, the corresponding unikn functions should only be used in contexts in which no better solutions are available or practical (e.g., when specifically creating images, or adding annotations to graphs).
Our templates — just like all others — are subject to constraints and limitations. As a standard installation of R lacks the “Theinhardt” fonts, we can only mimic the official design specifications (in Arial, sans serif). Nevertheless, the unikn package helps preventing common mistakes by novices (e.g., boxes or lines extending beyond text, or step-functions in multi-line titles) and can be customized and improved by expert users.
Overall, the unikn functions can be useful for solving color-related tasks and plotting graphical elements (e.g., boxes, logos, etc.). Ideally, it should help you in creating a stylish and recognizable design for your presentations and visualizations.

The unikn package is work in progress. We are currently working on:
Please comment on GitHub or contact us if you need additional features or want to help creating them.
The following versions of unikn and corresponding resources are currently available:
| Type: | Version: | URL: |
|---|---|---|
| A. unikn (R package): | Release version | https://CRAN.R-project.org/package=unikn |
| Development version | https://github.com/hneth/unikn/ | |
| B. Online documentation: | Release version | https://hneth.github.io/unikn/ |
| Development version | https://hneth.github.io/unikn/dev/ |
Please note and report any unikn-related issues at https://github.com/hneth/unikn/issues. We are looking forward to your feedback, comments, or questions.
![]()
The University of Konstanz’s Corporate Design (CD) was created by Strichpunkt GmbH and the University of Konstanz in 2014. The unikn package authors are members of the research group Social Psychology and Decision Sciences (SPDS) at the University of Konstanz. We facilitate access to CD elements for fellow users of R (e.g., for creating scientific visualizations), but all copyrights on the design remain with the original copyright holders.
We aim for an authentic representation of a highly-specified corporate design. While rigid specifications help to maintain coherence and consistency, they also tend to cause frustration in expert users. As the design has been developed in a flexible way that allows for individual elements to be modified as needed, we allow for some liberties, mostly by relaxing some restrictions. Examples include:
seecol() and
usecol() functions to color palettes);Signal color (from
pal_signal);

unikn by Hansjörg Neth and Nico Gradwohl is licensed under a Creative Commons Attribution-ShareAlike 4.0 International License. (Based on a work at https://github.com/hneth/unikn).
To support our efforts, please cite the unikn package in derivations or publications:
A BibTeX entry for LaTeX users is:
@Manual{,
  title = {unikn: Graphical elements of the University of Konstanz's corporate design},
  author = {Hansjörg Neth and Nico Gradwohl},
  year = {2023},
  organization = {Social Psychology and Decision Sciences, University of Konstanz},
  address = {Konstanz, Germany},
  note = {R package (version 0.8.0, January 6, 2023)},
  url = {https://CRAN.R-project.org/package=unikn},
  doi = {10.5281/zenodo.7096191},
}
The copyrights to all uni.kn designs remain with their original creators:
[File README.md updated on 2023-01-06.]