For the main worldmet website, see https://davidcarslaw.github.io/worldmet/.
![]()
worldmet provides an easy way to access data from the NOAA
Integrated Surface Database (ISD). The ISD contains detailed surface
meteorological data from around the world for over 35,000 locations. See
also the map.
The package outputs (typically hourly meteorological data) work very well with the openair package.
worldmet is available on CRAN and can be installed by
typing install.packages("worldmet").
Installation of the development version of worldmet from
GitHub is easy using the devtools package.
require(devtools)
install_github('davidcarslaw/worldmet')See the Articles tab for more information and interactive map examples.
To search for meteorological sites the user can search by the name or
partial name of the site in upper or lower case. The
getMeta function will return all site names that match the
search string. The most important information returned is the
code, which can then be supplied to the
importNOAA function that downloads the data.
For example, to search for site “heathrow”:
library(worldmet)
## user getMeta function to search for sites
## note code to be used in importNOAA
getMeta(site = "heathrow")
## # A tibble: 1 × 13
## usaf wban station ctry st call latitude longitude elev(m…¹ begin
## <chr> <chr> <chr> <chr> <chr> <chr> <dbl> <dbl> <dbl> <date>
## 1 037720 99999 HEATHROW UK <NA> EGLL 51.5 -0.461 25.3 1948-12-01
## # … with 3 more variables: end <date>, code <chr>, dist <lgl>, and abbreviated
## # variable name ¹`elev(m)`Often we have a latitude / longitude of interest. A search can be
made based on supplied decimal coordinates and the top n
nearest sites are returned. The map shows the location searched by the
user (red dot) and markers showing the nearest meteorological stations.
Click on a station marker to obtain the code and other basic
information.
## search for near a specified lat/lon - near Beijing airport
## returns 'n' nearest by default
info <- getMeta(lat = 40, lon = 116.9)
info
## # A tibble: 10 × 15
## usaf wban station ctry st call latit…¹ longi…² elev(…³ begin
## <chr> <chr> <chr> <chr> <chr> <chr> <dbl> <dbl> <dbl> <date>
## 1 545110 99999 BEIJING - … CH <NA> ZBAA 40.1 117. 35.4 1945-10-31
## 2 545270 99999 TIANJIN CH <NA> <NA> 39.1 117. 5 1956-08-20
## 3 545273 99999 BINHAI CH <NA> ZBTJ 39.1 117. 3 1981-11-25
## 4 545340 99999 TANGSHAN CH <NA> <NA> 39.6 118. 29 1956-08-20
## 5 544050 99999 HUAILAI CH <NA> <NA> 40.4 116. 538 1956-08-20
## 6 543080 99999 FENGNING CH <NA> <NA> 41.2 117. 661 1957-06-01
## 7 544230 99999 CHENGDE CH <NA> <NA> 41.0 118. 423 1956-08-20
## 8 544360 99999 QINGLONG CH <NA> <NA> 40.4 119. 228 1957-06-02
## 9 545390 99999 LETING CH <NA> <NA> 39.4 119. 12 1957-06-01
## 10 546020 99999 BAODING CH <NA> <NA> 38.7 115. 17 1956-08-20
## # … with 5 more variables: end <date>, code <chr>, longr <dbl>, latr <dbl>,
## # dist <dbl>, and abbreviated variable names ¹latitude, ²longitude,
## # ³`elev(m)`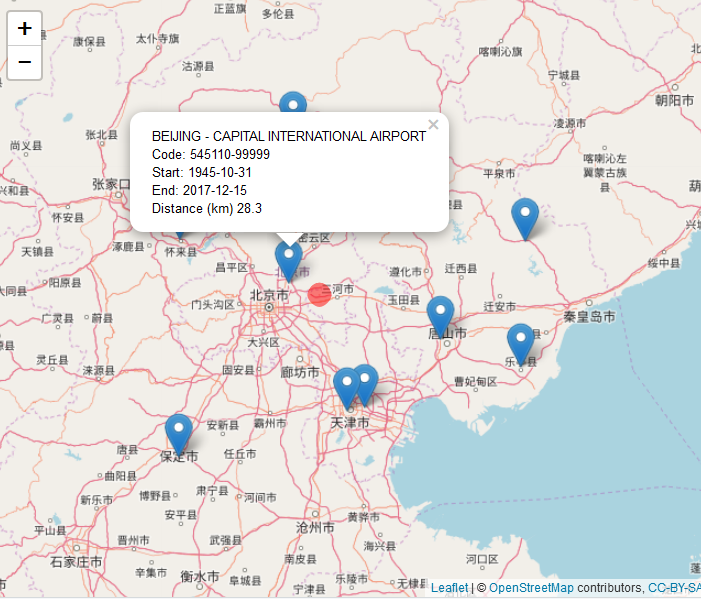
To obtain the data the user must supply a code (see
above) and year or years of interest. For example, to download data for
Heathrow Airport in 2010 (code 037720-99999):
met_london <- importNOAA(code = "037720-99999", year = 2010)
head(met_london)
## # A tibble: 6 × 25
## code station date latit…¹ longi…² elev ws wd air_t…³
## <fct> <fct> <dttm> <dbl> <dbl> <dbl> <dbl> <dbl> <dbl>
## 1 03772… HEATHR… 2010-01-01 00:00:00 51.5 -0.461 25.3 3.27 17.4 1.03
## 2 03772… HEATHR… 2010-01-01 01:00:00 51.5 -0.461 25.3 3.1 6.13 0.967
## 3 03772… HEATHR… 2010-01-01 02:00:00 51.5 -0.461 25.3 3.1 15.6 1.03
## 4 03772… HEATHR… 2010-01-01 03:00:00 51.5 -0.461 25.3 2.93 17.0 1
## 5 03772… HEATHR… 2010-01-01 04:00:00 51.5 -0.461 25.3 2.77 0.606 0.267
## 6 03772… HEATHR… 2010-01-01 05:00:00 51.5 -0.461 25.3 2.43 356. 0.0667
## # … with 16 more variables: atmos_pres <dbl>, visibility <dbl>,
## # dew_point <dbl>, RH <dbl>, ceil_hgt <dbl>, cl_1 <dbl>, cl_2 <dbl>,
## # cl_3 <dbl>, cl <dbl>, cl_1_height <dbl>, cl_2_height <dbl>,
## # cl_3_height <dbl>, precip_12 <dbl>, precip_6 <dbl>, pwc <chr>,
## # precip <dbl>, and abbreviated variable names ¹latitude, ²longitude,
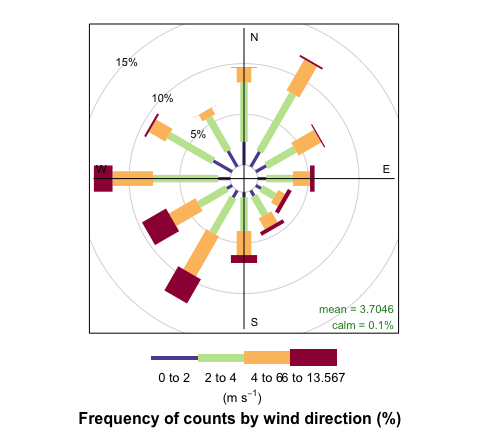
## # ³air_tempA wind rose (for example) can easily be plotted using
openair:
# load openair
library(openair)
windRose(met_london)